Product: GeoStudio Flow – SEEP/W, TEMP/W, CTRAN/W, AIR/W
Occurrence:
My flow results (in SEEP/W, TEMP/W, CTRAN/W, or AIR/W analyses) do not make sense and I would like to know why.
Resolution:
There are multiple reasons why the simulation results in a mass or heat transfer type of analysis may not make sense.
- Mesh size: The mesh size is too large, particularly in areas with high gradients (e.g. hydraulic, temperature, or concentration gradients).
- Time steps: The defined time steps are too large, so the solution is missing key behaviour occurring at smaller time intervals. Note, when the time interval size decreases, the mesh size may also need to decrease, particularly in areas with high gradients (indicating significant changes in the results over time). For analyses with complex boundary conditions, like the Land-Climate Interaction and Surface Energy Balance boundaries, a time interval between 30 minutes and 2 hours is required.
- Convergence: A converged solution has not been reached. After solving any type of GeoStudio analysis, the results convergence should be reviewed. Convergence results can be visualised on the model domain by going to View > Preferences and ensuring the Node Convergence option is selected (refer to the figure below). This option indicates nodes that have not reached either convergence criteria with a red ‘x’ and nodes that have only met one of the convergence criteria with a grey ‘o’. Refer to the convergence knowledge base article for more information about these symbols on your finite element mesh.

Multiple options are also available for investigating convergence results in the Draw Graph window. All flow products provide the ability to plot the unconverged nodes over time using the Convergence (each time step) graph type.

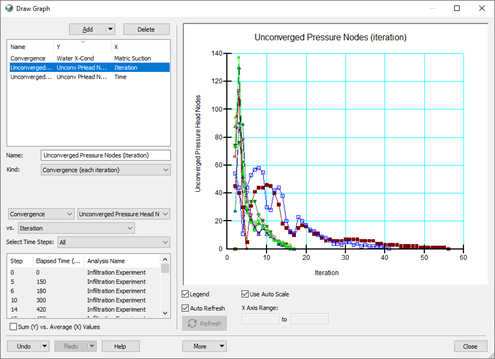
Alternatively, the unconverged nodes can be plotted over the iteration count for a given time step or multiple time steps as illustrated below, using a Convergence (each iteration) graph type.

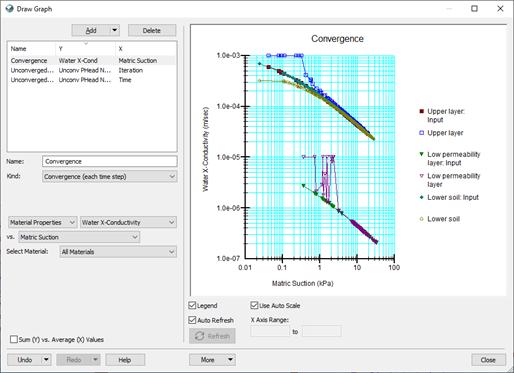
Finally for SEEP/W analyses, the material properties convergence graph can be used to check convergence. This plot represents the hydraulic conductivity functions of the materials in a given analysis. There are two plots for each material. The first represents the inputted hydraulic conductivity function, while the second represents the computed hydraulic conductivity values based on the pore water pressure results at the last iteration. If these two plots for a given material do not align, the analysis has convergence issues (as shown below).
