There are several ways to edit and modify an “Intrusion” surface within a GM; of them, value clipping is often overlooked. This document will outline the procedure for modifying intrusion surfaces by value clipping, describe the importance and relevance of volume points, and explain how the two are connected.
1.Value Clipping
Step 1 – Create a new geological model and intrusion surface
- Within the GM, create a new intrusion surface.
- Edit the surface accordingly, add a trend if necessary.
Step 2 – Modify the value clipping
- To modify the value clipping, double click the intrusion surface in the Project Tree.
- In the dialogue box that appears, click on the Surfacing Tab and check the “Show additional surfacing options” box.

- Once the box is checked, more tabs will appear. Click on the Value Clipping Tab.
- By default, an automatic value clipping already exists on the intrusion surface.

- Clipping can be modified here; however, before doing so it’s important to understand what these values represent and how changing them will modify the surface.
2. Volume Points:
Leapfrog constructs surfaces based on drillhole data and interpreted lines/points using a mathematical algorithm known as a Radial Basis Function (RBF). This algorithm relies on data points with known numeric values to interpolate surfaces in between said points. However, drillhole information is typically introduced into Leapfrog in interval tables that contain From-To intervals and lithology (etc.) codes, not numeric values. In order for Leapfrog to understand this information, it must first convert the interval data to point data and that point data must have associated meaningful numeric data. This resultant point data is known as Volume Points.
Every time a surface is created in Leapfrog from drillhole data, volume points are automatically generated. The distribution of Volume Points can also be modified, if necessary.
Step 1 – Accessing Volume Points
- In the Project Tree, click the little black triangle beside the surface of interest in the GM. The object below the surface is the contact points object.

- Drag the contact points object into the Scene Window. Select the points object in the Shapes list to activate the Properties panel in the lower right hand corner. In the Properties panel there is a tick box to “Show volume points”.

Step 2 – Explanation of Volume Points
- The red points have positive values and exist inside the unit of interest. The blue points have negative values and exist outside the unit of interest. The actual contact between two units is a green point with a value of 0.
- These values represent actual distances away from a contact point along the drillhole trace.

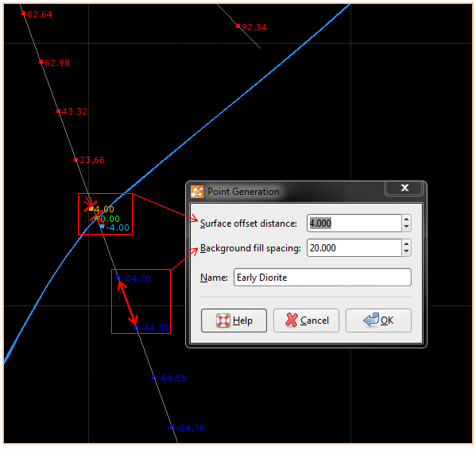
- The spacing of the points is defined by a “Surface offset distance” and a “Background fill spacing”, which are automatically generated based on the lateral extent of the data.
- Both these values can be changed by double clicking the points object to open the Point Generation window.

- The image below shows the results of the “Surface distance offset” and the “Background fill spacing”.
|
Definitions of “Surface distance offset” and “Background fill spacing” The Surface offset distance parameter sets the top and bottom ends of the interval and affects how a surface behaves when it approaches a contact point. A smaller distance restricts the angles that an approaching surface can take. Another factor that affects the angles a surface will take is whether or not a trend has been applied to the surface. The Background Fill Spacing parameter determines the approximate length of segments in the remaining intervals. If the remaining interval is not a multiple of the Background Fill Spacing value, Leapfrog Geo will automatically adjust the spacing to an appropriate value. A smaller value for Background Fill Spacing means higher resolution and, therefore, slightly smoother surfaces. However, computation can take longer. -Leapfrog Help File |
3. Volume Points and Value Clipping
The values that appear in the histogram on the Value Clipping page correspond to the generated volume point values. Below is a histogram example with no clipping. The positive values reflect the volume points that lie inside the unit of interest and the negative values reflect volume points that lie outside of the unit of interest. The 0 values are the contact points.
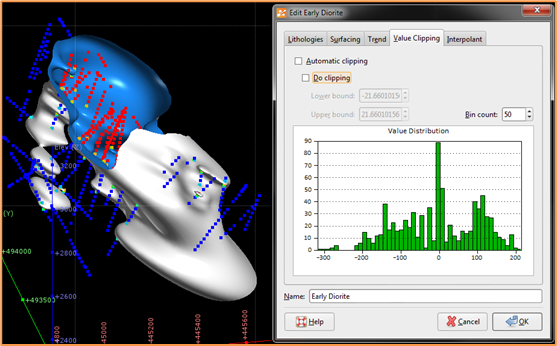
For larger intrusions, there will be a decent spread of positive and negative values, as appears in the image above. However, in the case of very small intrusions over laterally extensive projects, this distribution will be heavily skewed towards the negative numbers as there will be significantly more values outside the intrusion (i.e. negative) than there will be inside (i.e. positive).
Value clipping affects the distribution of volume point values and this in turn affects how the surface is interpolated between two known contact points. When a clipping value is applied to the lower bound, all values lower than that set value will be reassigned to equal the set clipping value; the same is true for when an upper bound is set.
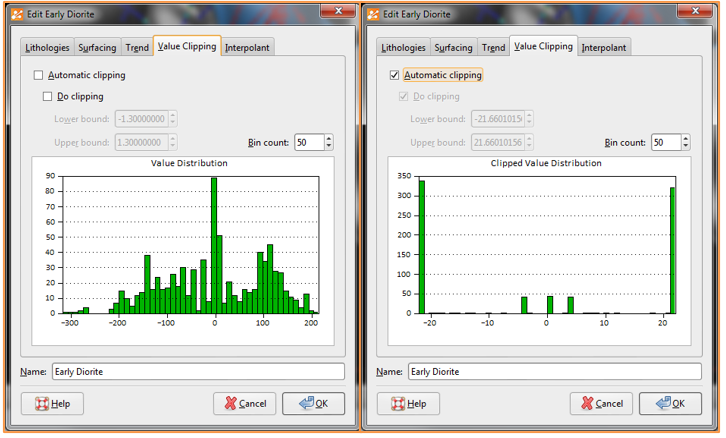
All values higher or lower than +/-21.66 equal +/- 21.66 when clipping is applied
Adjusting the value clipping has an effect on the volume of the intrusion, as well as its continuity. The volume of the intrusion can be determined by right clicking the Output Volume > Properties, and the continuity of an intrusion is represented by the number of parts it comprises (fewer parts = greater continuity). Below is a series of examples that show how value clipping affects the volume and continuity of this intrusion.
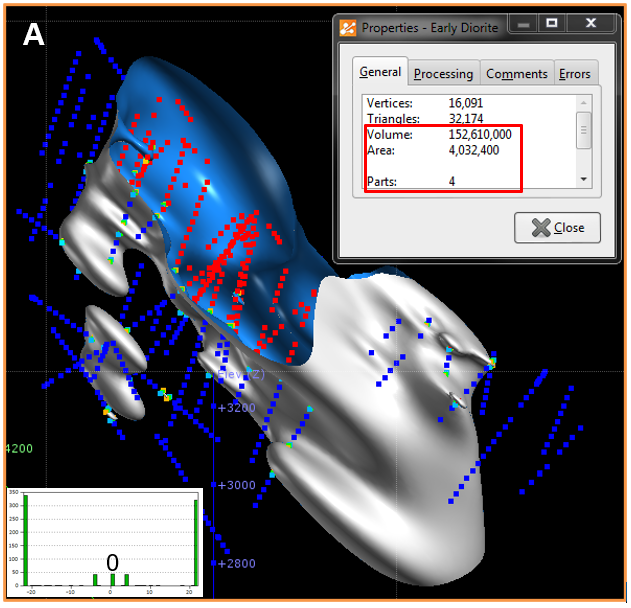
Automatic Clipping (Lower and Upper Bound Equal +/- 21.66)
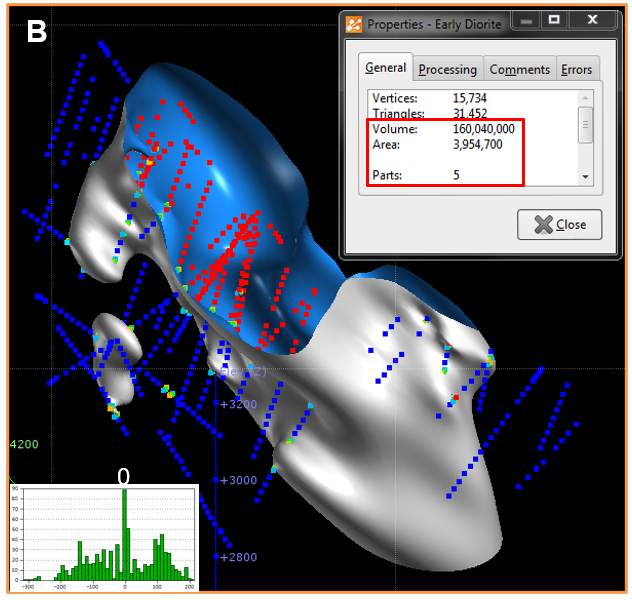
No Clipping (Lower Bound -312, Upper Bound +209)
Equal Weighting of Positive and Negative Values (Clipped to the Max/Min Values)
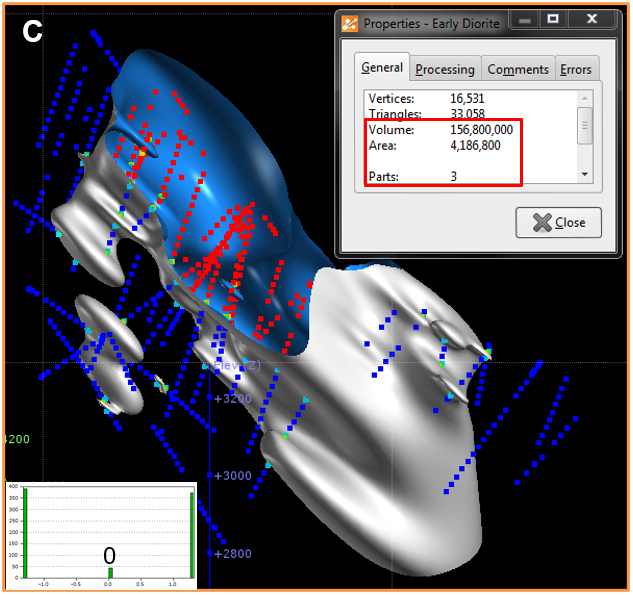
Manual Clipping (Limits - Lower Bound -1.3, Upper Bound +1.3)
Higher Weighting to Positive Values
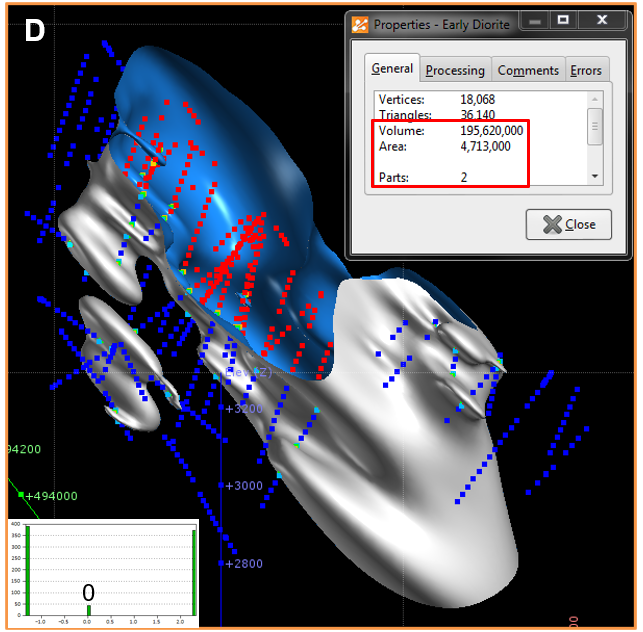
Manual Clipping (Limits - Lower Bound -1.3, Upper Bound +2.3)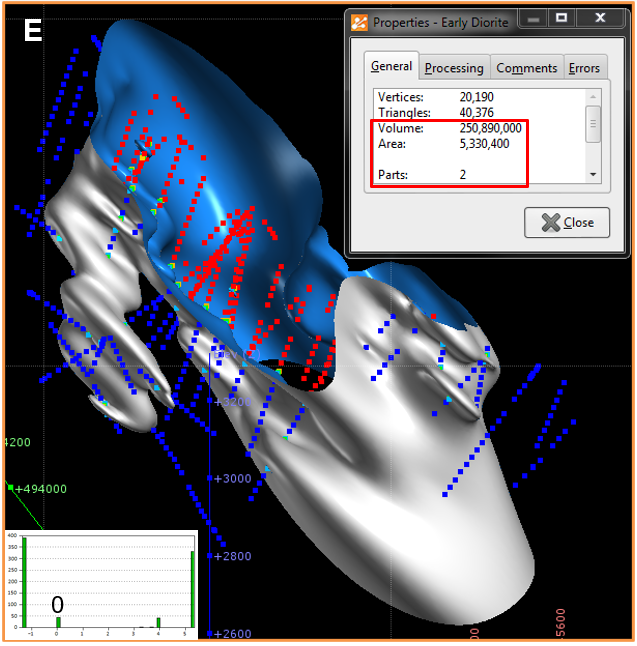
Manual Clipping (Limits - Lower Bound -1.3, Upper Bound +5.3)
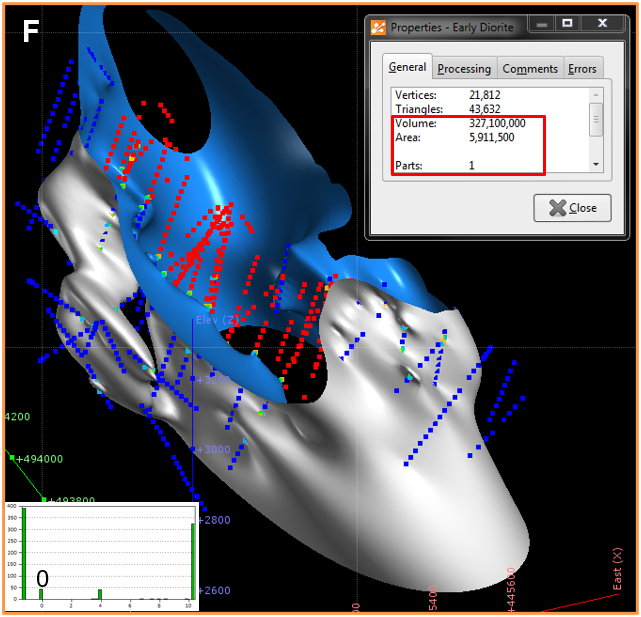
Manual Clipping (Limits - Lower Bound -1.3, Upper Bound +10.3)
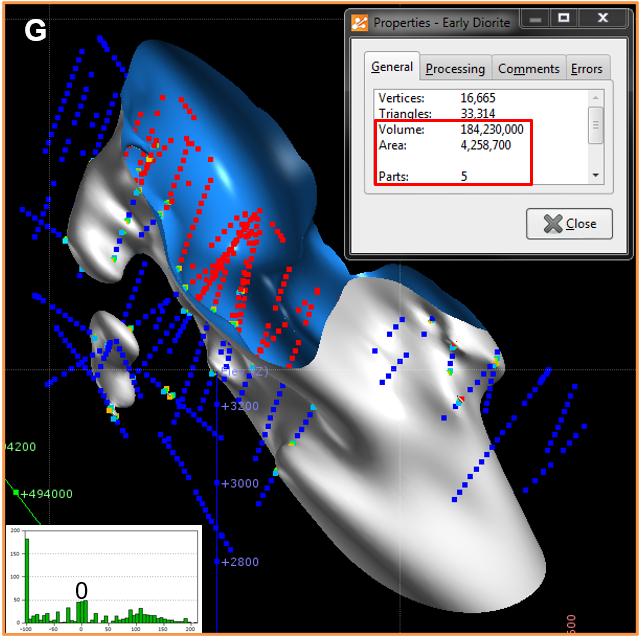
Manual Clipping (Lower Bound -100, Upper Bound +209)
Higher Weighting to Negative Values
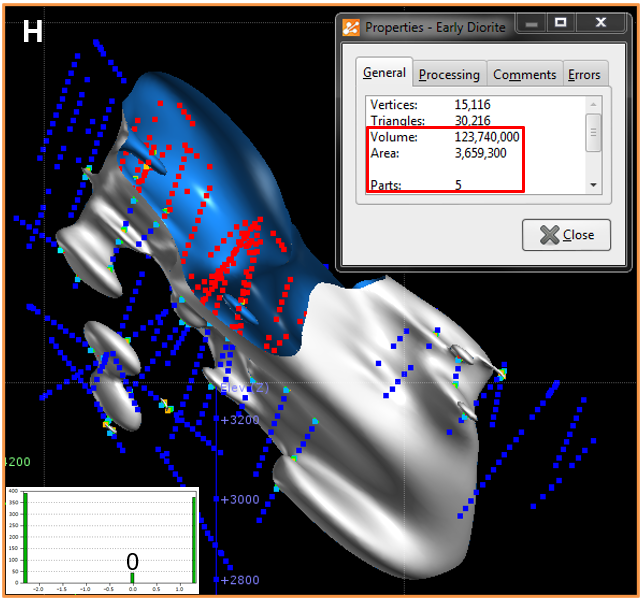
Manual Clipping (Lower Bound -2.3, Upper Bound +1.3)
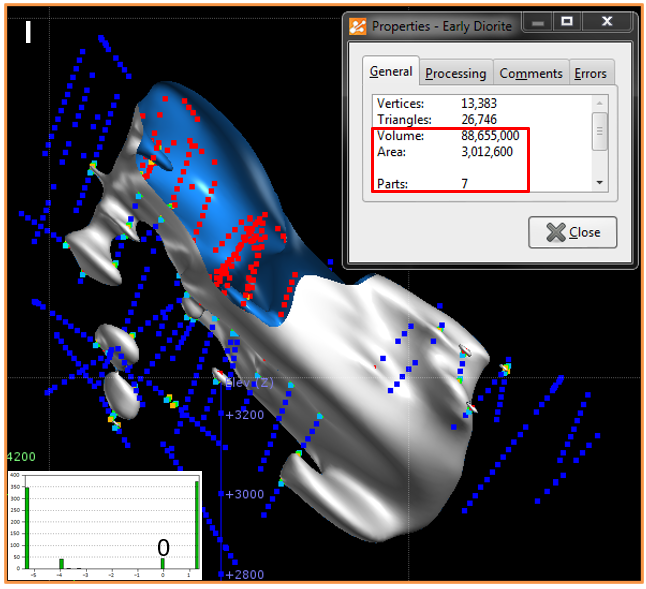
Manual Clipping (Lower Bound -5.3, Upper Bound +1.3)
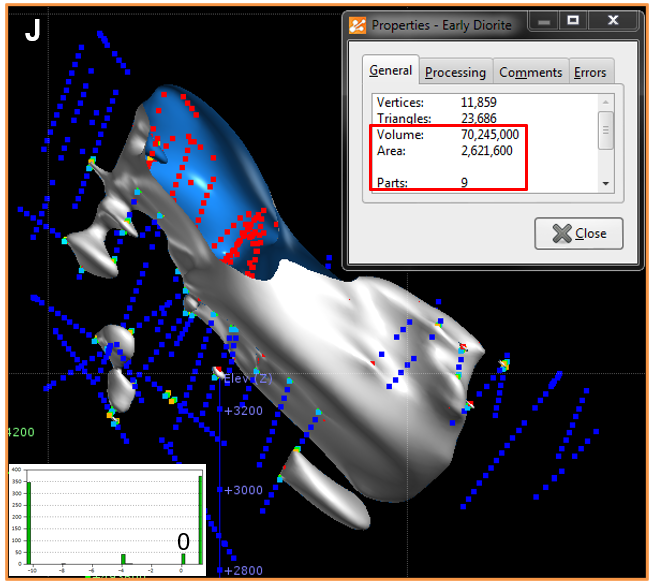
Manual Clipping (Lower Bound -10.3, Upper Bound +1.3)
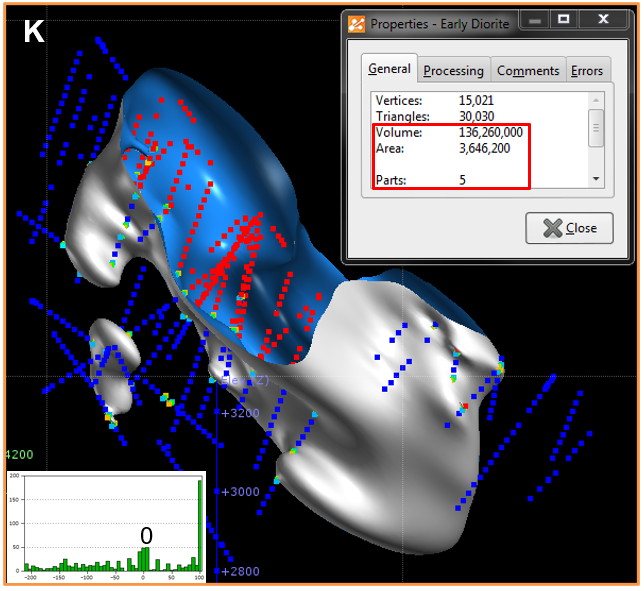
Manual Clipping (Lower Bound -209, Upper Bound +100)
Comparisons and Observations:
- Figures A and B – the automatic clipping provides greater continuity to the intrusion (4 vs. 5 parts), as well as a slightly reduced volume (reduced relative influence of negative values).
- Figure C – reducing the clipped value to the lowest possible value results in an increase in continuity.
- Figures D, E, F – using Figure C as a baseline, Figures D, E and F show that increasing the weight of the positive values, while clipping the negative value to its upper limit, increase both the volume and continuity of the intrusion. The influence of the positive values (i.e. the values within the intrusion) is greater than the influence of the negative values, allowing the surface to expand. Figure F is an extreme example.
- Figure G – the relative difference (ratio) between the negative and positive values has a greater effect on the intrusion volume and continuity than the absolute difference.
- Figures H, I, J - using Figure C as a baseline, Figures H, I and J show that increasing the weight of the negative values, while clipping the positive value to its lower limit, decrease both the volume and continuity of the intrusion. The influence of the negative values (i.e. the values outside of the intrusion) is greater than the influence of the positive values, forcing the surface to contract. Figure J is an extreme example.
- Figure K – the relative difference (ratio) between the negative and positive values has a greater effect on the intrusion volume and continuity than the absolute difference.
- Modifying the surface distance offset and background fill spacing in the point generation window will also have a small effect on the overall volume and continuity.