Objective:
To get more information from Leapfrog when it has encountered an error that caused it to stop unexpectedly, using the Windows Reliability Monitor diagnostic tool. This information can then be passed through to the support team to help diagnose the issue.
Resolution:
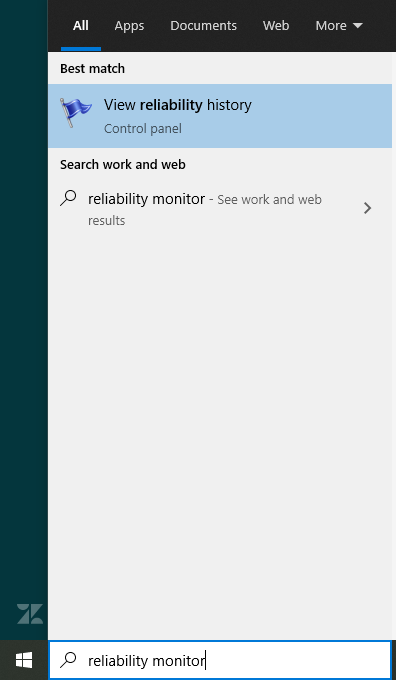
Open the Windows start menu and type in 'Reliability Monitor'. Then select the 'View reliability history' option.

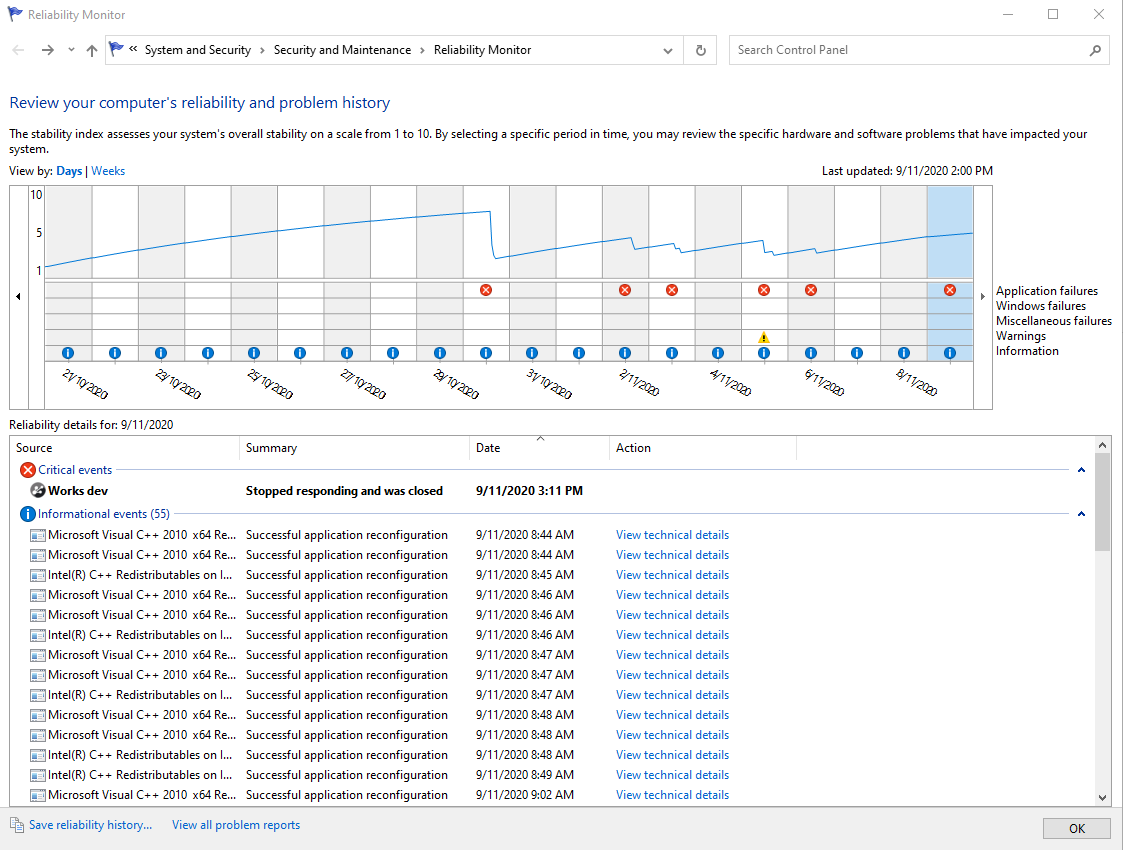
Once open, a timeline is shown at the top of the monitor, with red crosses showing days where serious errors have occurred (e.g. an application has crashed).

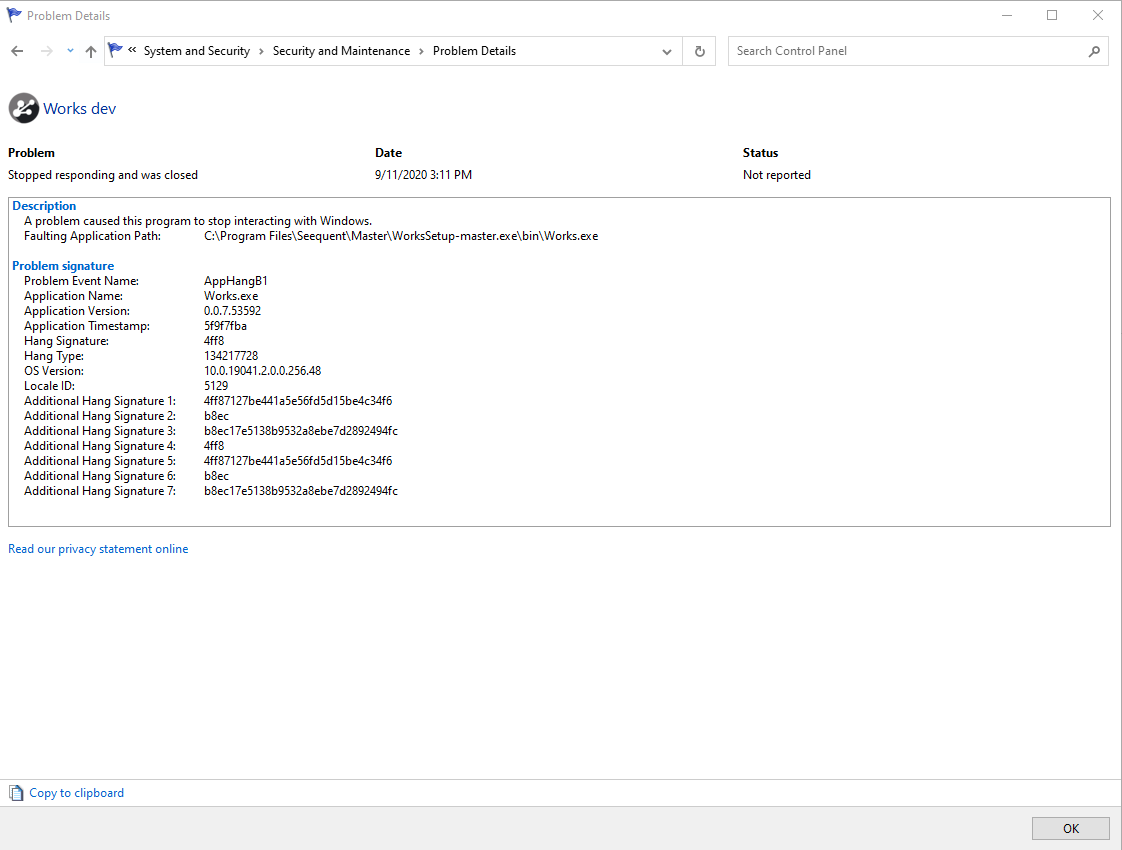
Click on the day in the timeline when the error occurred to see all events from that day. Application crashes should be listed under 'Critical events' so look for the appropriate application here (e.g. Geo.exe). Double click on the crash entry to open a page showing the technical details of the crash.

Either take a screenshot of these details or use the 'Copy to clipboard' option in the bottom left and send this information to the support team in order to help them diagnose the cause of the issue and provide a solution.
Notes:
These instructions are for a Windows 10 operating system. Steps for other operating systems may differ.