Symptom:
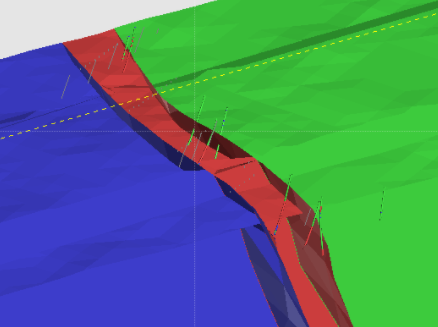
Leapfrog seems to display section/view artefacts as transparency appears on solids while opacity is set at 100%.
E.g. Seeing drillholes through meshes (example picture below).


Root Cause:
It is usually due to erroneous data in the projects: X, Y, Z data mixed in the collar, point, polyline table either during import, use of different coordinate systems or resulting from mistakes while manually handling the data, etc.
In consequence, the loaded objects present a huge extent that is too large for Leapfrog to handle. This would cause graphic artefacts as described above.
Resolution:
The first thing would be to check for erroneous data. This can be done with the following steps:
- Clear the scene and to only load back the drills/points;
- Go to the "Look" dropdown in the top toolbar and click "reset" or hit the "home" key
If the zoom goes exaggeratedly far out then, you may have data that make the project extents huge.
The next thing to do is to find the data causing the problem:
- Open the collar/point table by double-clicking on it in the project tree;
- Reorder the columns by clicking on the x,y,z row at the top;
- Pick up the data that look mixed up or erroneous;
- Either ignore these data/ delete them from the import file OR fix them in the database and then reload the table.
Notes:
This article provides steps that generally resolve the issue. These artefacts could be linked to the graphic cards. Also, if above steps don't work then we will need to investigate further by either reviewing a copy of the model/data or screenshare.